Metrics Module: Alliance View
Introduction
This page is designed to provide a consolidated view of the key performance indicators of the organization’s tribes, organized by alliance. Through an interactive dashboard, it is possible to clearly and objectively visualize and analyze the key data of each tribe, allowing for a detailed monitoring of team performance.
General Information
This page is designed to provide a consolidated view of the key performance indicators of the organization’s tribes, organized by alliance. Through an interactive dashboard, it is possible to clearly and objectively visualize and analyze the key data of each tribe, allowing for a detailed monitoring of team performance.
The key indicators presented on this page include:
- Average Lead Time: The average time from the start to the completion of a task or project.
- Average Queue Time: The time elapsed from the commitment point of the issue to its completion.
- Average Process Time: The time elapsed from the start of active work on the issue until its completion.
- Average Throughput: The average amount of work completed over a specified period.
- Score (and, when applicable, the Scoring Matrix): A general assessment of the performance of the tribes based on previously defined metrics.
The dashboard provides an integrated view of the tribes’ performance from the perspective of the parent organization, enabling comparative analysis between the different units. It also allows for a quicker identification of areas that require improvement or adjustments.
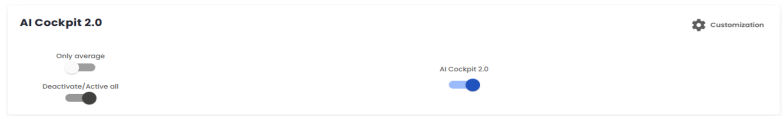
- The "Only Average" toggle button – when activated, displays only the average data for the tribes’ indicators.
- The "Enable/Disable All" toggle button – enables or disables the information for all tribes related to the indicators.
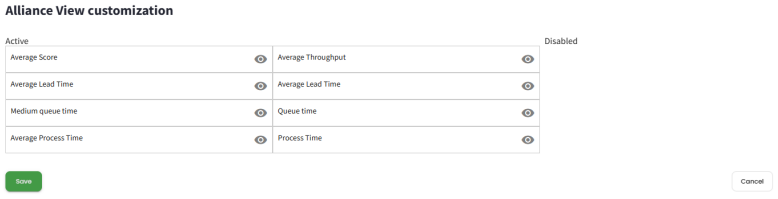
- The "Customization" button – opens a modal where the user can select which indicators to display. It is possible to disable those that will not be used, allowing for a personalized view according to the analysis needs.
- Lastly, there are separate "toggle" buttons for each tribe, allowing the user to enable or disable the tribes that are currently part of the indicator analysis.
Indicators
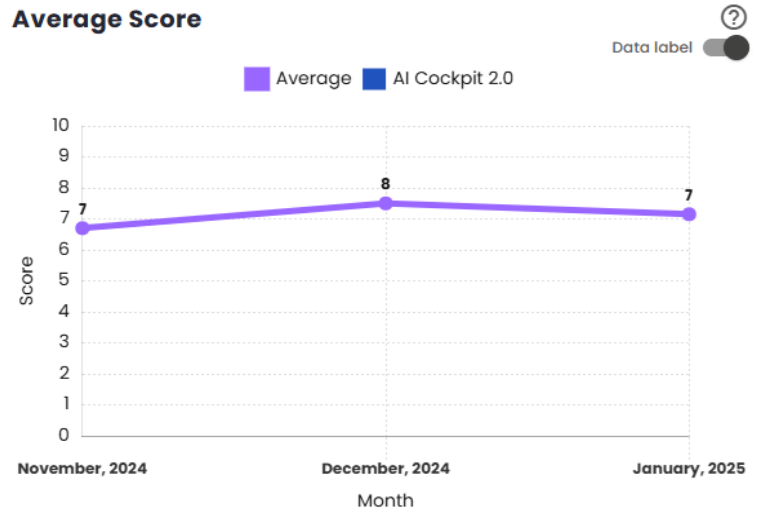
Average Score
This indicator shows the average evolution of the VSM (Value Stream Management) Main Score for organizations, covering different levels such as tribe, corporation/guild, chapter, headquarters, administration, department, and area over time. The average calculated for the chart excludes zero scores for the month, ensuring that only relevant data is considered in the analysis. This way, the visualization accurately reflects the performance of organizations, without null values distorting the interpretation of the results.
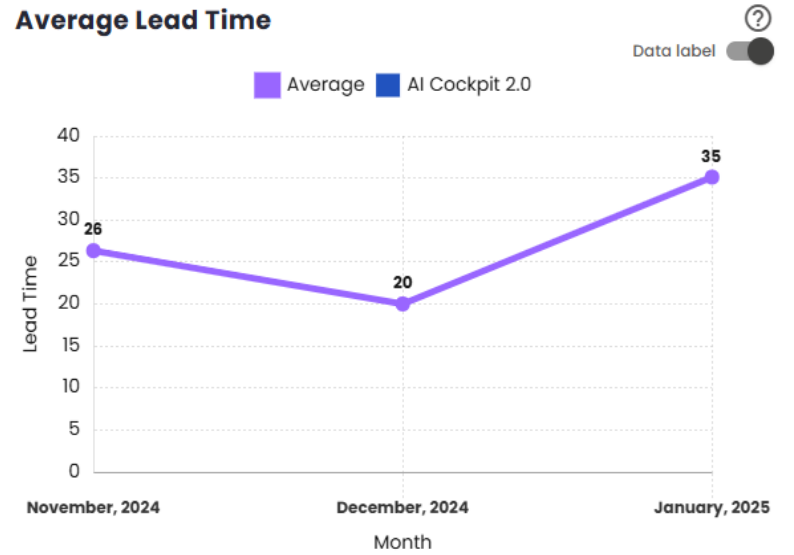
Average Lead Time
This indicator shows the evolution of Lead Time for organizations, covering different levels such as tribe, corporation/guild, chapter, headquarters, administration, department, and area over time. Lead Time is defined as the total time elapsed between the creation of an issue and its completion. The average displayed in the chart excludes zero scores for the month, ensuring that the calculation reflects only the periods in which there was activity, providing a more accurate view of the organizations’ performance over time.
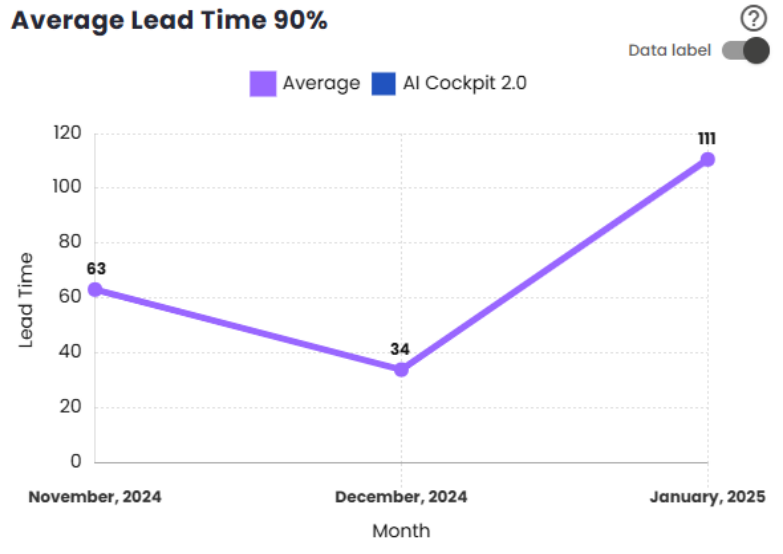
Lead Time N-th Percentile
This indicator shows the evolution of Lead Time for organizations, covering different levels such as tribe, corporation/guild, chapter, headquarters, administration, department, and area over time. Lead Time is defined as the time elapsed between the creation and completion of an issue. For this indicator, the N-th percentile is considered, which can be 75%, 80%, 85%, 90%, or 95%, representing the cutoff point that groups the issues within the analyzed period. The average displayed in the chart excludes zero scores for the month, ensuring that only relevant data is considered in the performance analysis.
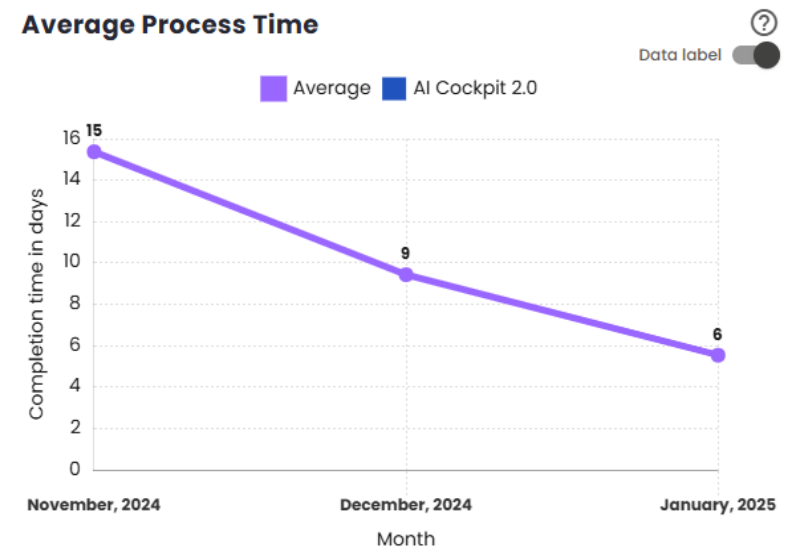
Average Process Time
This indicator shows the evolution of Process Time for organizations, covering different levels such as tribe, corporation/guild, chapter, headquarters, administration, department, and area over time. Process Time is defined as the time elapsed from the moment work begins on an issue until its completion. The average displayed in the chart excludes zero scores for the month, ensuring that the calculation reflects only periods with activity, providing an accurate view of the organizations’ performance in the process.
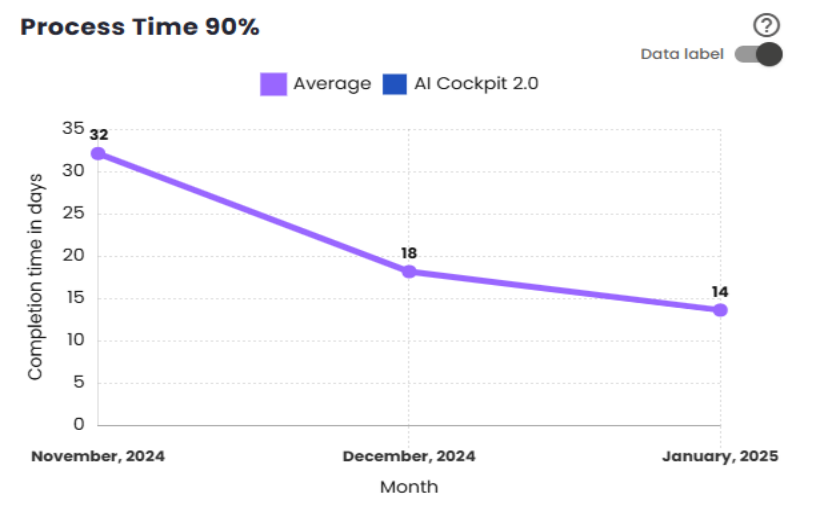
Process Time N-th Percentile
This indicator shows the evolution of Process Time (or Touch Time) for organizations, covering different levels such as tribe, corporation/guild, chapter, headquarters, administration, department, and area over time. Process Time is defined as the time elapsed from the moment work begins on an issue until its completion. For this indicator, the N-th percentile is considered, which can be 75%, 80%, 85%, 90%, or 95%, representing the cutoff point that groups the issues within the analyzed period. The average displayed in the chart excludes zero scores for the month, ensuring that the calculation takes into account only relevant data for an accurate analysis of performance in the process.
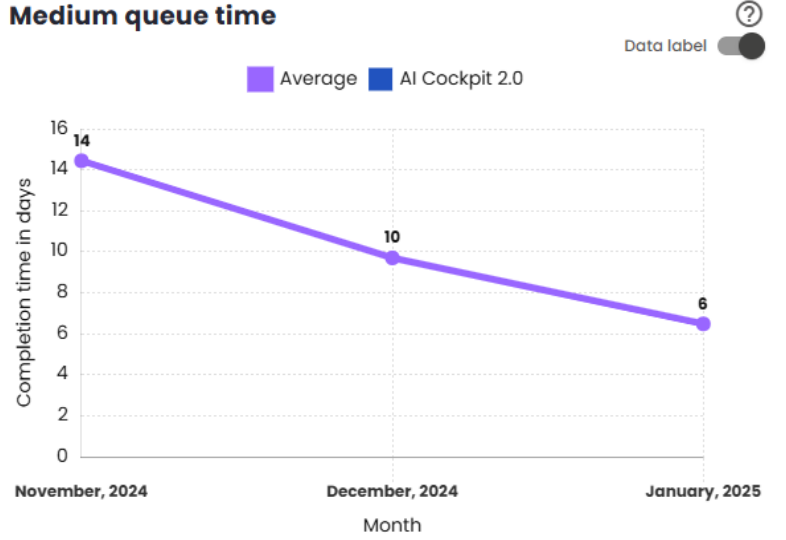
Queue Time
This indicator shows the evolution of Queue Time for organizations, covering different levels such as tribe, corporation/guild, chapter, headquarters, administration, department, and area over time. Queue Time is defined as the time elapsed between the point when an issue is committed to and its completion. The average displayed in the chart excludes zero scores for the month, ensuring that the calculation reflects only periods with relevant activity, providing an accurate view of the waiting time of issues within the process.
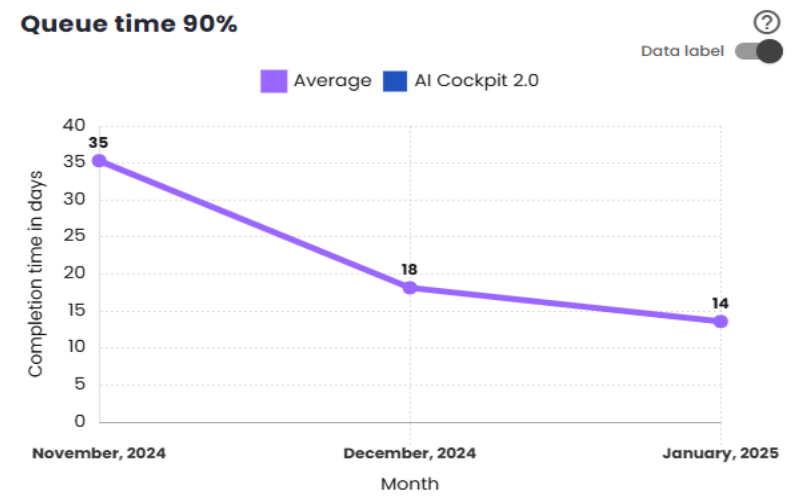
Queue Time N-th Percentile
This indicator shows the evolution of Queue Time for organizations, covering different levels such as tribe, corporation/guild, chapter, headquarters, administration, department, and area over time. Queue Time is defined as the time elapsed between the point when an issue is committed to and its completion. For this indicator, the N-th percentile is considered, which can be 75%, 80%, 85%, 90%, or 95%, representing the cutoff point that groups the issues within the analyzed period. The average displayed in the chart excludes zero scores for the month, ensuring that the analysis reflects only periods with relevant activity, providing an accurate view of the waiting time of issues within the process.
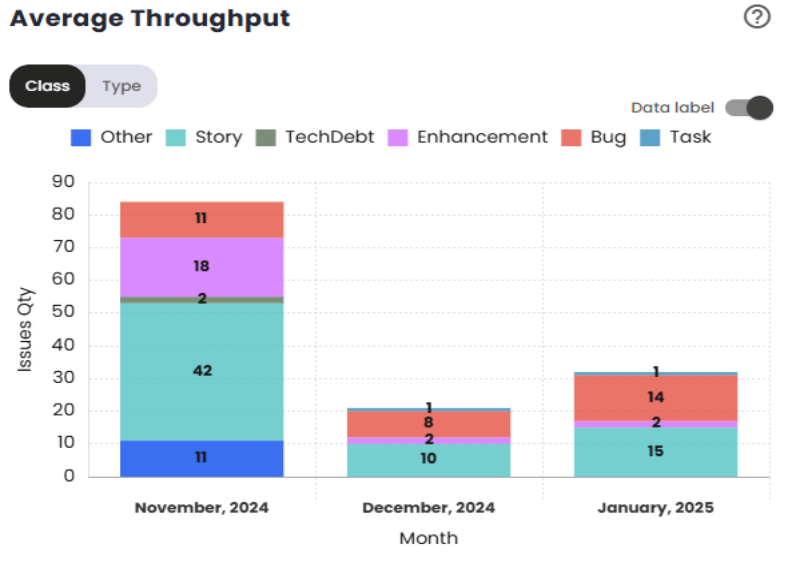
Throughput
This indicator shows the average number of issues (separated by type) for organizations, covering different levels such as tribe, corporation/guild, chapter, headquarters, administration, department, and area, during a specific month. The chart displays the average number of deliveries made by the organizations within the analyzed period. For example, if in a given month Tribe A delivered 5 Stories and Tribe B delivered 7 Stories, the chart will show an average of 6 completed Stories for the month. This indicator allows for evaluating the volume of work completed by the teams, providing a clear view of the organizations’ productivity over time.