Metrics Module: Squad Maturity
Introduction
This item of the Metrics module provides a comprehensive view of the teams’ development in relation to their maturity. It allows tracking of indicators through graphs and tables, in addition to offering a broad perspective on the evolution of each team over time.
Squad Maturity
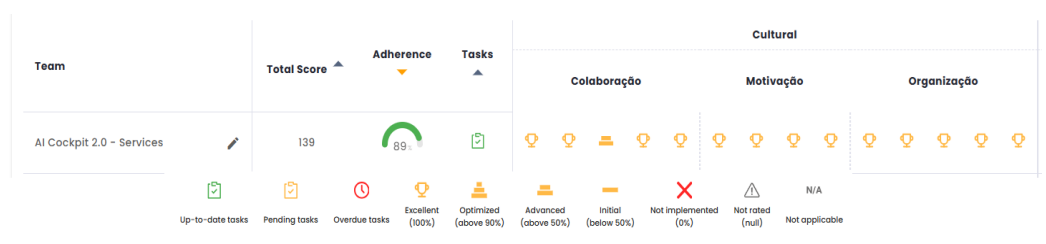
By clicking on "Go to matrix" or in the sidebar menu "Maturity matrix", a page opens where you can better visualize the values assigned to each indicator and the origin of the score displayed in the chart on the main page. The indicators are grouped by their categories, and each one is associated with a symbol that represents its average. In the figure below, you can see an example of squad indicators and the legend for the symbols linked to them.
When you click on a squad from this maturity list, you are directed to that squad’s individual maturity page. Below is an example of the page.
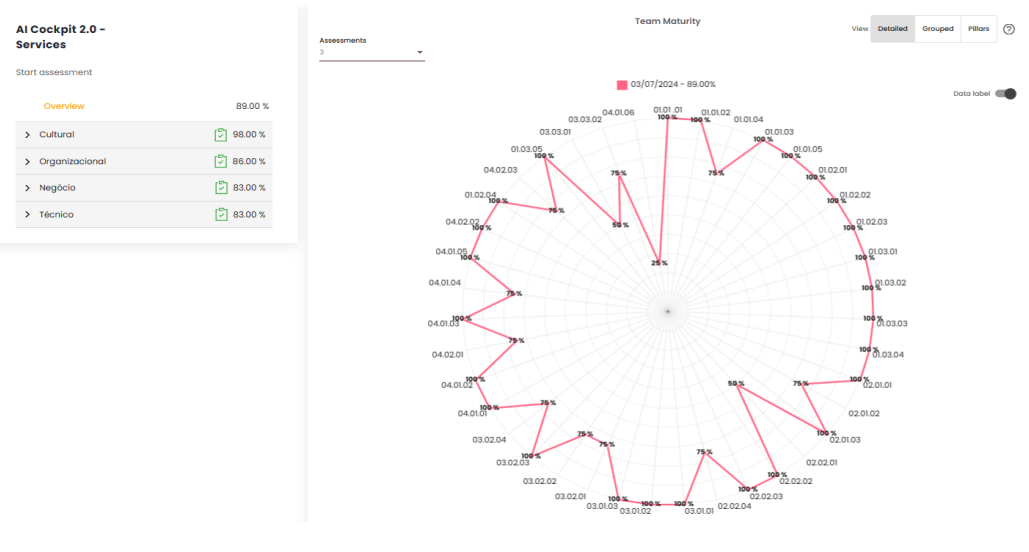
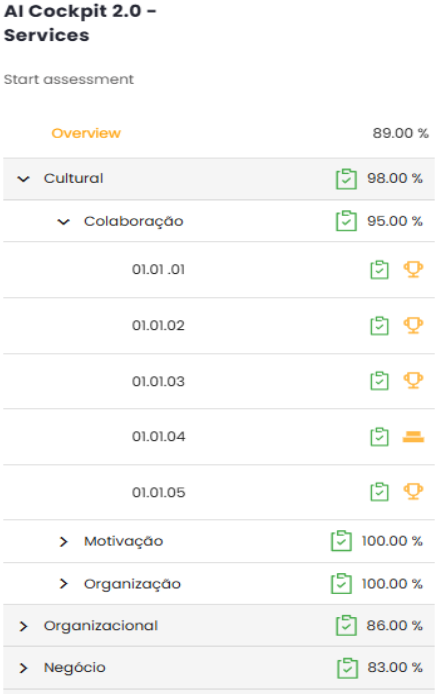
On the left side, you have a list of indicators that make up the squad’s maturity, separated by themes, sub-themes, and items within each sub-theme. For each item, you can check whether the deadlines are being met and the percentage of efficiency relative to the indicator.
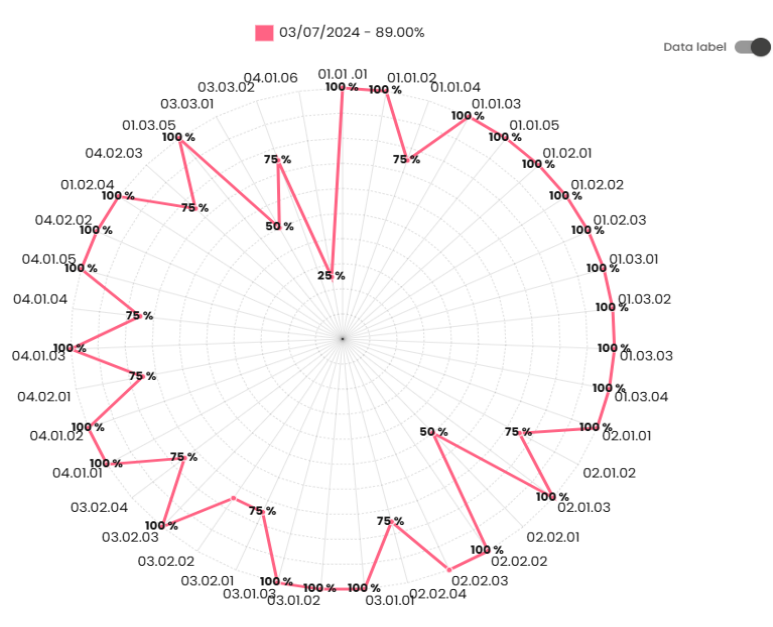
In the Matrix section itself, there are three types of analysis: Detailed, Grouped, and Pillars. The charts provide a visual representation of the previously mentioned indicators, offering a more concise and summarized view.
Detailed
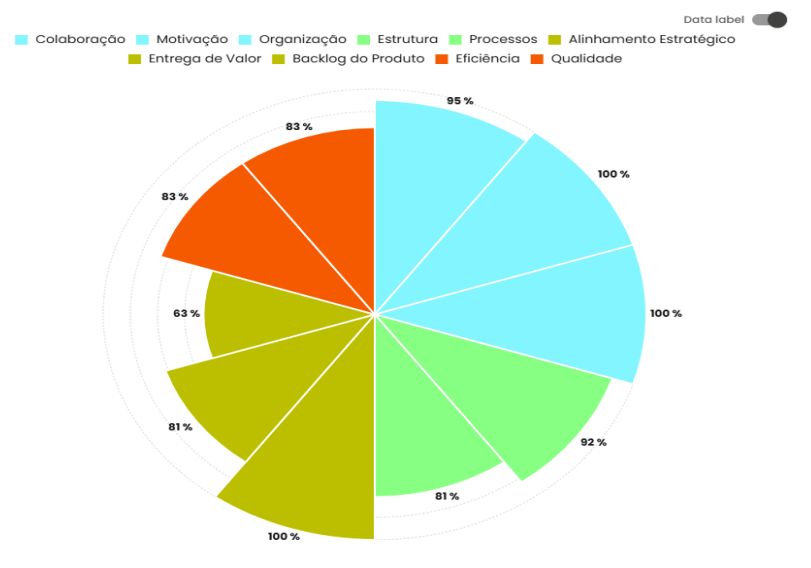
Displays the indicators without grouping them by categories or subcategories.
Grouped
Displays the indicators grouped by categories and subcategories, showing the average scores per subcategory. This view is in the testing and feedback collection phase and may be subject to instability and frequent updates.
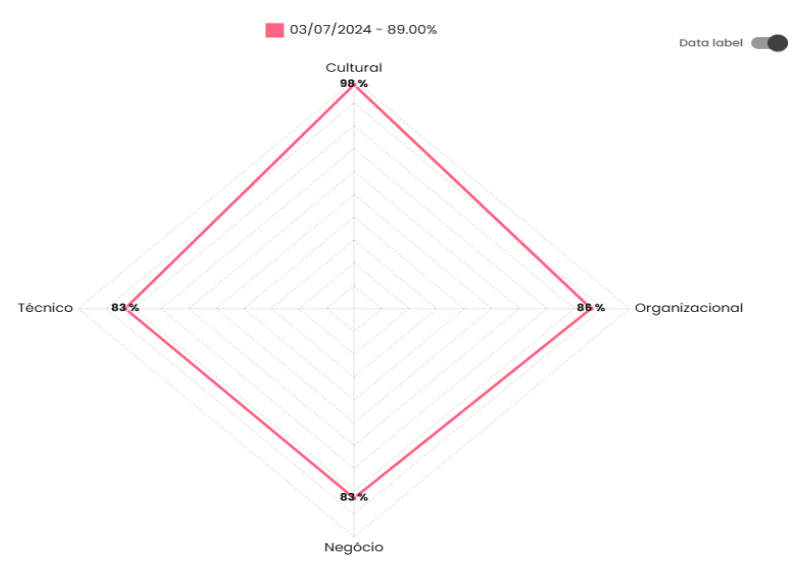
Pillars
Shows general indicators by category, based on the registered pillars. It allows you to visualize the squad’s performance with each assessment applied.
Evolution
This page allows tracking the team’s evolution based on the values entered in the maturity matrix over time. The figure below shows how the screen appears.
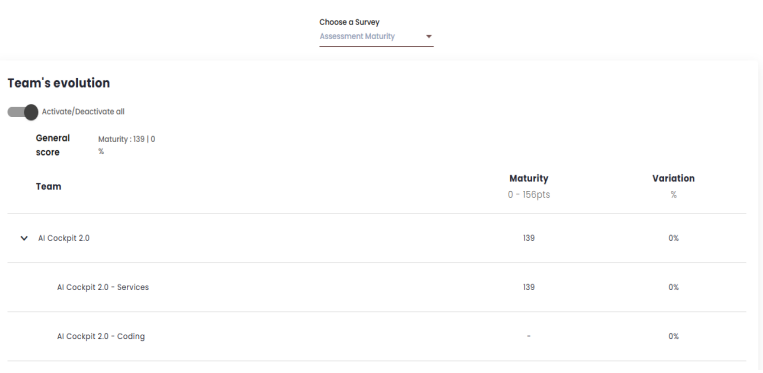
At the top of the page, it is possible to select which matrix you want to view. This allows you to see all the teams registered in the organization, their previous and current scores, as well as the variation in these scores.